Plotting
Choose the plots that meet your situation most accurately.
1. Ranking
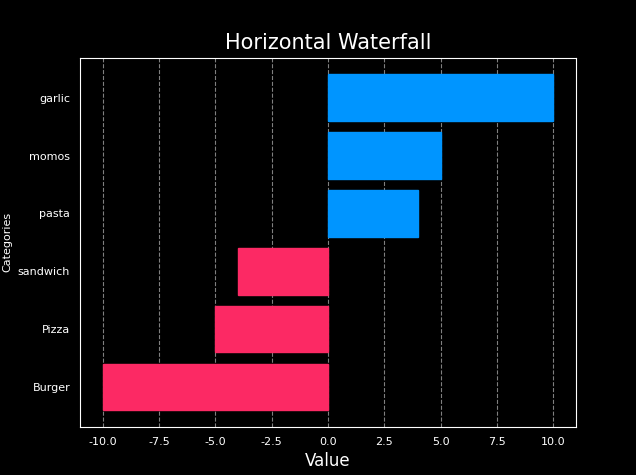
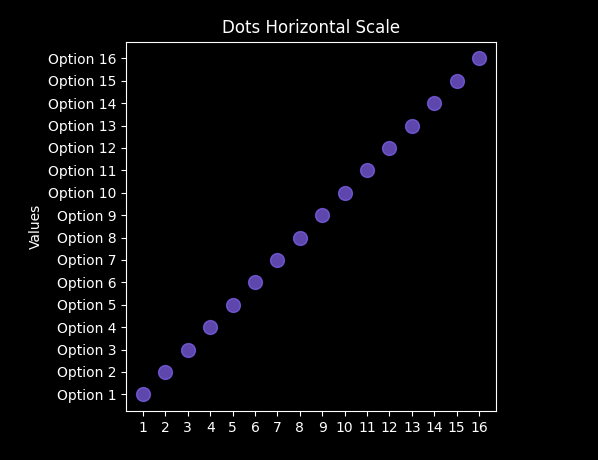
Which item is the best/worst?
| A. Horizontal Waterfall | B. Dotplot |
|---|---|
 |
 |
2. Deviation
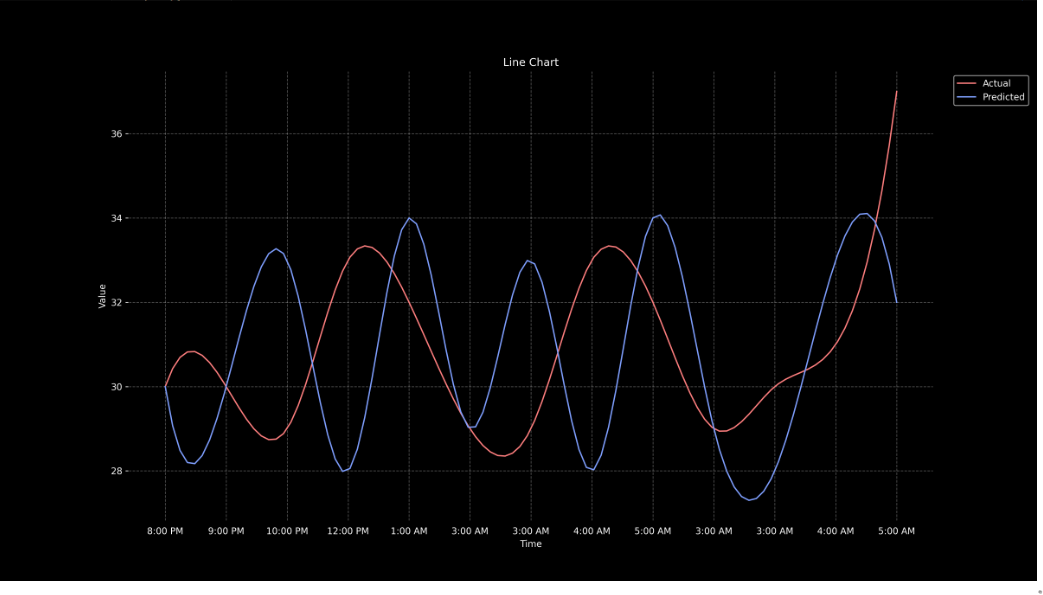
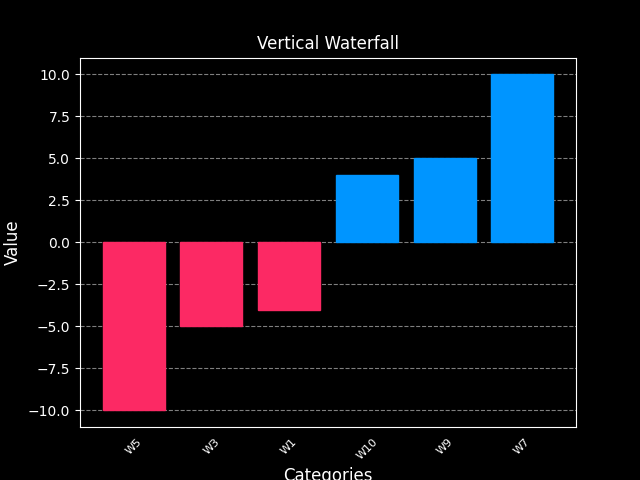
Plot A. is the choice to use for time series data. B is used for categorical data.
| A. Line Chart | B. Vertical Waterfall |
|---|---|
 |
 |
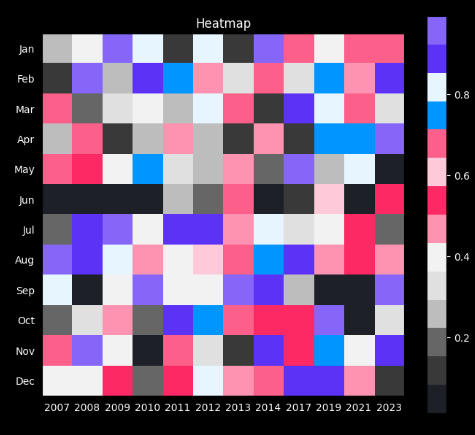
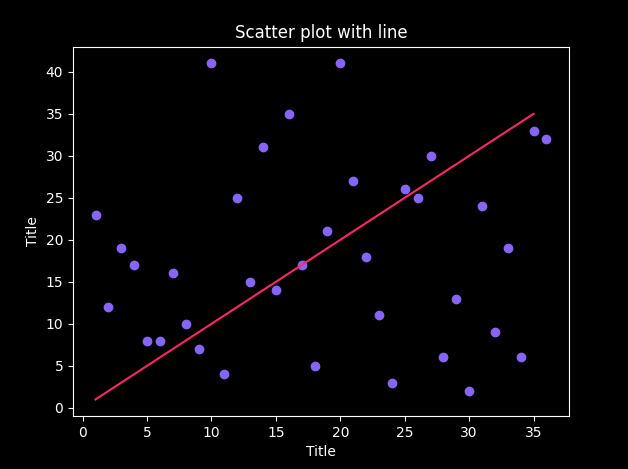
3. Correlation
Don't use A unless you have to (e.g. categorical data because it's hard to read)
| A. Heat Map 2 | B. Scatter Plot With Line |
|---|---|
 |
 |
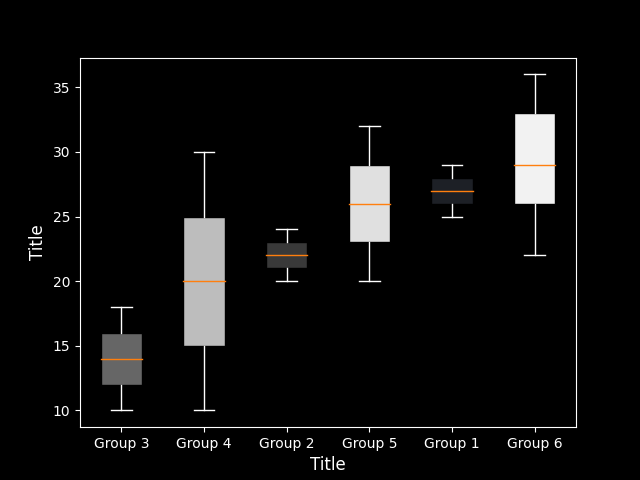
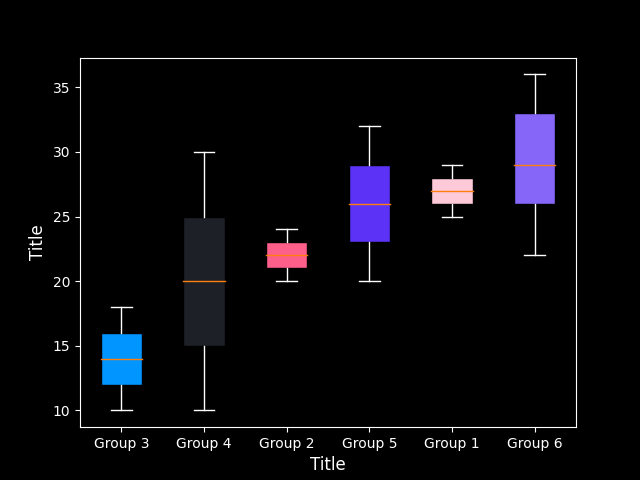
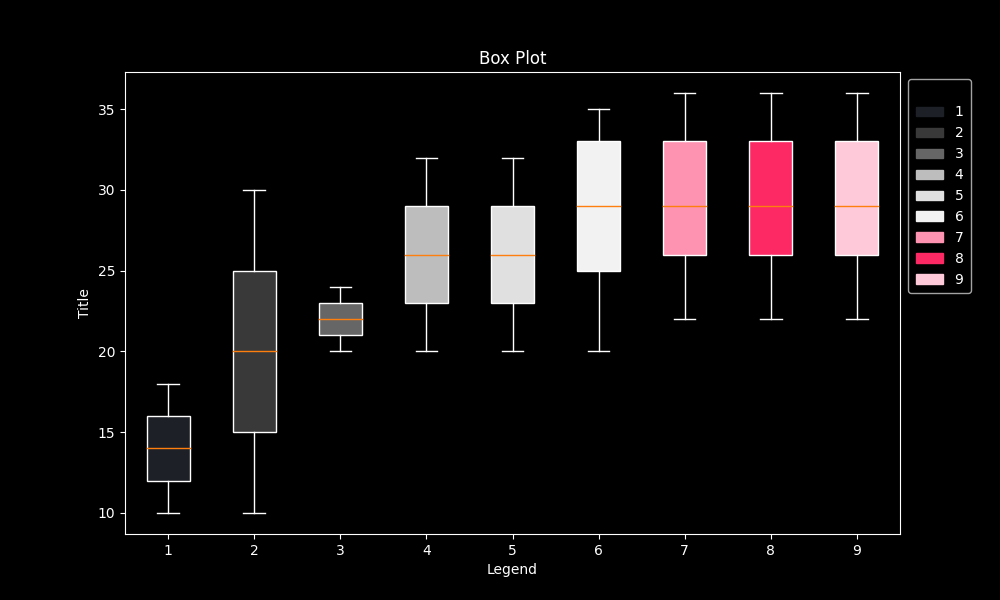
4. Distribution
| Boxplot | Boxplot 2 | Boxplot 3 |
|---|---|---|
 |
 |
 |
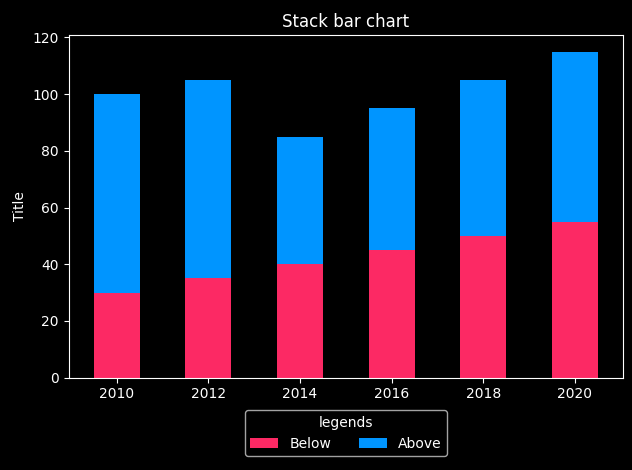
5. Evolution
| Line Chart | Stack bar |
|---|---|
|
 |